~Sexy RSI~Fellow sexy traders,
Wrote this to save time from constantly having to add my own horizontals/MAs to the default RSI so I decided to make this modification.
The default settings include channels from 40-80 (green horizontals) for a bullish range, and 20-60 (red horizontals) for the bearish range.
Also includes white line at 50 level, and blue horizontals at extremes (90 and 10).
If RSI stays in one of the red or green range that can signify the trend direction, as directed by Andrew Cardwell (inventor of the RSI ).
If you wish for other levels to be included, just let me know. Comment on here or dm me on twitter @boss_charts and I might add the settings for you.
Additionally, in order to tell the level of the RSI and how overextended it might be, I added the setting for the RSI to change color depending on its level. Current settings are as follows:
Normal RSI (30-70) = PURPLE
Conventional Overbought/Oversold (30-20 + 70-80) = RED
1st extended (20-15 + 80-85) = PINK
2nd extended (15-10 + 85-90) = ORANGE
VERY EXTENDED (<10 + >90) = YELLOW
That way you can get an idea of how drastic a move is by the color alone.
Finally, there are the default MAs added that Mr. Cardwell defines as useful for defining the trend. These being the 9 MA and 45 EMA/WMA.
The strategy with these is to have the MAs on both price and RSI . If the 9MA is above the 45 MA on both price and RSI , then this is bullish and you can look for longs.
Conversely, if the 9 is below the 45 on both RSI and price that is bearish , and you can look for shorts.
I added the background color change for the points where the MAs cross each other, so you do not have to have the MAs fogging up your charts to know where they are relative to one another. This is similar to my MA cross indicator which contains the same functionality.
Never financial advice. Back test it for yourself and find MA configurations that work for you.
在腳本中搜尋"ma cross"


[ALERTS] MA Cross ElevenThis script is a crossing of eleven different MA, with alerts and SL and TP.
The simplest is what works best.
SMA --> Simple
EMA --> Exponential
WMA --> Weighted
VWMA --> Volume Weighted
SMMA --> Smoothed
DEMA --> Double Exponential
TEMA --> Triple Exponential
HMA --> Hull
TMA --> Triangular
SSMA --> SuperSmoother filter
ZEMA --> Zero Lag Exponential
Using "once per bar close" repaint is 0%, but if you like risk can choose "once per bar", better profit.
Thanks to JustUncleL and his amazing sripts.

Projection MAUse this indicator to see how the MA will behave in the future, not considering the future price action. It can be used to predict higher or lower probabilities of MA crosses.
Can be used on any time frame. If anyone knows a decent way to configure color from the settings menu with a single argument, instead of adjusting for each dot, let me know.
Multi SMA EMA WMA HMA BB (5+5 MAs + Bollinger Bands) MTF by RRBMulti SMA EMA WMA HMA BB (5+5 Moving Averages of Any Type with Bollinger Bands) MTF by RagingRocketBull 2018
Version 1.0
This indicator shows multiple MAs of any type (SMA EMA WMA HMA etc) with BB and MTF support
There are several versions: Simple, MTF, Pro MTF and Ultimate MTF. This is the MTF version. The Differences are listed below. All versions have BB
- Simple: you have 2 groups of MAs that can be assigned any type (5+5)
- MTF: +assign 1 custom Timeframe to any group combo (5+5 Custom TF)
- Pro MTF: +multiple Timeframes for multiple MA groups (4*3 MTF), horizontal levels and show max bars back options
- Ultimate MTF: +individual settings for each MA, multiple Timeframes
There are 2 groups of MAs, 3rd group is BB. You can:
- show/hide all MAs in a group. Use length 0 to hide a particular MA independently or uncheck in Style.
- apply any MA type to all MAs in a particular MA group. For example, you can assign all EMAs the HMA type. Groups are called EMAs and SMAs just for reference.
- assign Custom Timeframe to a particular MA/BB group combination or all groups. For example, show daily (D) EMAs+SMAs on H1 Timeframe, or only H4 (240) BB on H1.
You can use different types of MAs as dynamic S/R levels to trade of off and MA crosses as signals for possible trend change (golden/death bull/bear crosses).
Current Timeframe MAs can be used together with Custom Timeframe MAs on a single chart. Higher TF MAs are more important than lower TF MAs.
Most common MA types are: SMA, EMA, WMA, HMA.
Most common MA lengths are: 12, 20, 26, 30, 50, 100, 200, 400 etc.
MTF Notes:
- Script UI uses simple timeframe textbox instead of input resolution dropdown to allow for 240 120 and other custom TFs
- Groups that are not assigned a Custom TF will use Current Timeframe (0).
- MTF will work for any MA type assigned to the group. BB group always uses SMA type.
- MTF works both ways: you can display a higher TF MA/BB on a lower TF or a lower TF MA/BB on a higher TF.
- MTF MA values are normally aligned at the boundary of their native timeframe. This produces stair stepping when a higher TF MA is viewed on a lower TF.
Therefore Point Density/Smoothing is applied by default on MA MTF for visual aesthetics. Set to 0 to disable and see exact ma mtf values (lines with stair stepping and original mtf alignment).
- Smoothing is disabled for BB MTF because fill doesn't work with smoothed MAs after duplicate values are replaced with na.
- MTF MA Value fluctuation is possible on the current bar due to default security lookahead
Features:
- 2 groups of custom 5+5 MAs of any type including Hull Moving Average (HMA)
- BB
- 1x Custom Timeframe with step line smoothing for 3 groups (MAs + BB)
1. based on 3EmaBB, uses plot, fill, security, change, barstate, stdev and custom hma functions
2. you can't set certain constants from input due to Pinescript limitations - change the code as needed, recompile and use as a private script version
3. you can't have plot* inside ?/if/for/function, and implementing condition forks using 2 sets of plots (na vs non-na) doubles indicator params and styles - confusing
4. swma has a fixed length = 4, alma and linreg have additional offset and smoothing params
Feel free to use. Good Luck!

Multi SMA EMA WMA HMA BB (5+5 MAs + Bollinger Bands) by RRB
Multi SMA EMA WMA HMA BB (5+5 Moving Averages of Any Type with Bollinger Bands) by RagingRocketBull 2018
Version 1.0
This indicator shows multiple MAs of any type (SMA EMA WMA HMA etc) with BB on a chart at the same time with/without MTF support depending on the version.
There are several versions (published later): Simple, MTF, Pro MTF and Ultimate MTF. This is the Simple version. The Differences are listed below. All versions have BB
- Simple: you have 2 groups of MAs that can be assigned any type (5+5)
- MTF: +assign 1 custom Timeframe to any group combo (5+5 Custom TF)
- Pro MTF: +multiple Timeframes for multiple MA groups (4*3 MTF), horizontal levels and show max bars back options
- Ultimate MTF: +individual settings for each MA, multiple Timeframes
You can use different types of MAs as dynamic S/R levels to trade of off and MA crosses as signals for possible trend change (golden/death bull/bear crosses).
Most common MA types are: SMA, EMA, WMA, HMA.
Most common MA lengths are: 12, 20, 26, 30, 50, 100, 200, 400 etc.
Features:
- 2 groups of custom 5+5 MAs of any type including Hull Moving Average (HMA)
- BB
1. based on 3EmaBB, uses plot, fill, stdev and custom hma functions
2. swma has a fixed length = 4, alma and linreg have additional offset and smoothing params
Feel free to use. Good Luck!

Spectro™ M by HypesterThis is the commercial version of the Spectro™ M
The new BADASS Spectro™ M
Ok, I gotta say this is so cool that I've been dying to write this release note, we're really proud with the amazing features we are releasing and the fact we could deliver them without raising the prices.
Spectro™ Alerts New Settings
The classic and loved entry/exit point finder, and now you can set the Spectro™ Alerts to your own preferences from aggressive to the safest triggering style. So now it can adapt to any trading style easily, from minute-leveraged scalping to yearly positions.
Spectro™ Indicator (Pro 8X Indicator )
This is the Spectro™ brain, and before this update, it was an indicator that was worth extra $10, but now we decided to implement it on the M version for free! Knowing how Spectro™ is behaving will give you an edge when forecasting entry/exit points.
Spectro™ Direction Change Alerts
A life saver, subscriber's words not mine. Spectro™ plots warning signs when it detects possible trend changes before they happen!
Spectro™ Multi-Resolution
Another heavily requested feature, now you can check buy/sell alerts from other timeframes on your chart. Let's say you're trading on 5M but you only want the strongest signals, so you set your custom timeframe to 15M. Or if you are trading a 12H timeframe and you are sure of a reversal and you're trying to catch the bottom so you play around with the custom resolution around 30M~2H for a more reactive triggering.
Or you might just want to confirm if you have a buy on the Daily before proceeding, that's a smart way to check the mid-range trend.
Specter Clouds
This is dope. I wish I could be more polite but this is as badass as it gets. This awesome new feature will tell you when the price is growing or decreasing out of the "organic" area, therefore, it will warn that whatever you're seeing, you shouldn't. In plain English: It means a reversal is coming.
But it doesn't only warns you about reversals several bars before, it also forecasts the future price targets for the respective reversal!
Also, the coloring of the cloud helps you find the bottom/top, the very beginning of the following reversal.
X Algo Confirmations
This is practical as ****! We know you guys are always checking other indicators to improve your odds so we decided to do it for you, but faster, better and more precise. We called it X because it checks so many indicators that we just called it X.
This is a proprietary blend weighted average between several indicators, you can name all the common ones...STOCH, RSI, STOCH RSI, BB, DMI, ATR, MFI, OBV, CCI, MFI, DPO, MACD, EMO, TSI, Elliot Waves, Fractal Patterns, Fibonacci LEVELS...well you get it... plus 3 proprietary indicators on the conservative mode. Now speaking English: We check up to 20 indicators for you and deliver it in a way that all it takes is one second to check ALL of them.
It also has an aggressive, moderate and conservative mode. The difference is just the amount indicators we check for you, more confirmations you need, more conservative you are.
Trend Analyser 2.0
We offer 3 types of TA. A brand-new proprietary price-based trend analyzer that warns you about violent price change and corrections, an MA blend good for scalping and spotting trend reversals and a classic fully customizable MA crossing.
Spectro offers you 8 different types of the most popular moving averages for the custom mode, from Simple Moving Averages to Fractal Moving Averages - so that creates 64 basic trend analyzer options. You can change the lookback (length) period, time frame resolution, and more. Resulting in a very flexible, simple to use and powerful trend analyzer with endless customization options.

Net Volume [frac]This indicator attempts to estimate the net volume influx into the market. Recommended visual settings include turning off the "Net Volume Raw" output, and only paying attention to the Net Volume Channel and MA series.
Input parameters allow users to either toggle on volume to be in shares (or in cryptocurrency coins) volume or to be in USD equivalent. Careful here for any derivative contract tickers, as having it checked to USD will in essence square the USD volume (since derivative contracts are in USD volume already)
My personal favorite settings at the moment are 130 for the channel length, and then leaving it set to MA mode, with MA's 12, 26, and 52 -- EMA mode.
Simple rundown:
- Positive values correlate to a net volumetric influx into the market. This is bullish. Volume is flowing into the market.
- Negative values correlate to a net volumetric flow out from the market. This is bearish. Volume is flowing out of the market.
Trading signals:
- Most obvious is crossover of the zero line, either for long or short.
- Divergence (lower high, higher high on price, or higher low, lower low on price)
- Signal crossover / MA crossover -- most important for trending markets that are either very bullish / very bearish, and counter trading the market.

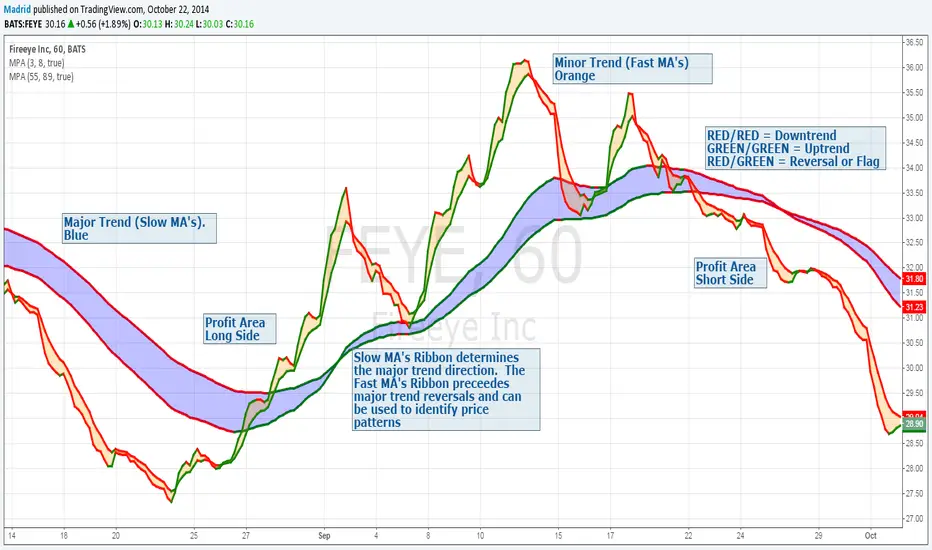
Madrid Profit AreaThis study displays a ribbon made of two moving averages identified by a filled Area. This provides visual aids to determine the trend direction and pivot points. The moving average will be Red if its value is decreasing, and green if it is increasing. When both MA's are the same color we have a trend direction. If those are different then we have a trend reversal and a pivot point.
If combined with another ribbon then it can be configured so we have a pair of slow MA's and another pair of fast MA's , this can visually determine if the price is in bull or bear territory following the basic rules:
1. Fast MA pair above the slow MA Pair = Bullish
2. Fast MA pair below the slow MA Pair = Bearish
3. If the fast MA crosses over the slow MA it is a Bullish reversal
4. If the fast MA crosses below the the slow MA, it is a Bearish reversal.
The use of the ribbons without the price bars or line reduces the noise inherent to the price
3 MAs Flexíveis (Tipos Variáveis)Multi-Type 3 Moving Averages (Fully Customizable)
This indicator plots three independent moving averages on the chart, designed for traders who want full control over their trend tools.
Each moving average can be configured separately:
Custom period
Custom price source (close, open, hl2, etc.)
Selectable MA type:
EMA – Exponential Moving Average
SMA – Simple Moving Average
WMA – Weighted Moving Average
HMA – Hull Moving Average
RMA – Smoothed MA (used in RSI)
VWMA – Volume-Weighted Moving Average
Individual color, line thickness and show/hide option
Typical use cases:
Build short-, mid- and long-term trend structure (e.g. fast/medium/slow MAs)
Use as dynamic support and resistance
Visual confirmation of momentum shifts when the fast MA crosses above/below the slower ones
Adapt the MA type to your strategy (e.g. HMA for smoother trend, VWMA for volume-sensitive moves)
This tool is purely visual and analytical: it does not generate signals or alerts by default, making it ideal as a base layer to combine with your own price action or indicator strategy.

Day Trading Astra by Pooja📌 Day Trading Astra by Pooja
Day Trading Astra by Pooja is specily designed for F&O Traders, a clean and fast momentum-shift indicator designed to support day traders with clear entry signals and structured filtering.
It uses a refined RSI–MA crossover engine, allowing traders to visualize momentum transitions directly on the price chart with minimal clutter.
✨ Key Features
🔶 1. RSI–MA Crossover Engine
Identifies potential momentum shifts using a fast RSI and smoothed RSI-MA baseline.
🔶 2. Clean BUY/SELL Chart Signals
Markers appear directly on the candle chart—easy to read, no extra panes.
🔶 3. Smart Filtering System (Optional)
To help reduce low-quality signals in uncertain conditions:
ADX trend-strength filter
ATR volatility check
Slope validation
Minimum bars between two signals
🔶 4. Alert + Webhook Ready
Supports TradingView alerts and webhook integration for automation tools.
Each alert includes symbol, direction, price, timestamp, unique ID, and an optional secret key for secure execution.
🔶 5. Multi-Timeframe Flexible
Works across all timeframes; users can apply it according to their day-trading style.
📝 How to Use
Add indicator to chart.
Select your preferred filters or use default settings.
Enable alerts if automated notifications are needed.
Combine with your own risk management and trading framework.
This tool is meant to support analysis, not replace personal judgment.
⚠️ Disclaimer
This script is a technical analysis tool and not financial advice.
Results vary depending on market conditions and user settings.
No indicator can guarantee profits or eliminate risk.
Always test settings before applying them in live markets.
The user is fully responsible for all trading decisions.
⭐ Summary
A clean, fast, and structured momentum-entry tool designed to help day traders identify potential intraday shifts with clarity and alert support.

RSI ✶ YSTCThis is a Bonus Indicator from YSTC's Volume Profile Tools.
Relative Strength Index (RSI)
A momentum based oscillator which is used to measure the speed (velocity) as well as the change (magnitude) of directional price movements.
What Different about this RSI by YSTC.
You get Support and Resistance lines for RSI which are 20, 30, 40, 50, 60, 70, 80. as shown below.
It can also show RSI Candles as shown below.
For those who want all types of MA with MA Cross can play with this indicator. Below is MA Cross of 9, 21.
And for NEW user with untrained eyes who cant yet detect Divergence this indicator Saves you the trouble of finding.
Below is Regular Bullish and Bearish Divergence. Linewidth 2.
Below is Hidden Bullish and Bearish Divergence. Linewidth 1.
You can add this script to your chart by clicking "Add to favorites" button.
Have Questions ?
Contact: +91 9637070868.
Name: Yogesh Patil (YS Trading Coach).
Time: Monday to Saturday (10:00 AM - 06:00 PM).
Visit our website - YS Trading Coach .
FREE Self Study Yourself Course: Trading with Price Action Volume .
Free Stock Market Introduction Available here .
Paid Course: Trading with Price Action Volume
Paid Volume Profile Tools available here.

BaH4iK_StaategyThis indicator is a flexible strategy builder for TradingView, allowing traders to combine and customize popular entry/exit signals, filters, and overlays into a single tool. The indicator supports a wide range of technical methods and provides modular configuration for advanced strategy design.
How it works:
The user can select from dozens of entry types (trend, breakout, oscillator signals), confirmation filters (EMA, SMA, MA crosses, volatility, custom range filters), overlays, dashboards, and risk settings.
Key logic includes conditional sampling for EMAs and SMAs, multiple range and trend-detection systems (Range Filter, Supertrend, Half Trend, Rational Quadratic Kernel), and integration of classic confirmation indicators (TSI, VWAP, RSI, MACD, CCI, Ichimoku, Donchian, Bollinger Bands, etc.).
Signal expiry features, alternate signals, and dashboard visualization are built-in. Filters can be stacked/combined or toggled via the settings panel.
Features:
Entry/exit signals: LONG/SHORT labels, arrows, dashboard summary
Signal confirmation: EMA/SMA/MA crosses, trend, range, oscillator filters
Custom overlays: supply/demand zones, pivot levels, ranges, fractals, volume bands
Modular configuration: choose methods, combine signals, tune sensitivity and cooldown
Advanced filters: trend alignment, volatility breakout, multiple timeframe signals
Risk management: automate signal expiry, stop-loss, TP projections, risk/reward display
Dashboard panel: flexible position, size, session overlays, instant summary of conditions
UI: All interactive controls and outputs (labels, tooltips, dashboard text) default to English; if other language is used in UI, translation is provided in this description.
How to use:
Add the indicator to your chart, then use the settings panel to select entry type, confirmation logic, overlays, and dash display. Combine filters to custom-build rules. Use labels/arrows and dashboard to monitor entries and manage risk. Designed for manual, semi-automatic and automated strategy development.
Originality:
This tool is not just a mashup of popular methods but provides a true framework for custom strategy creation directly on TradingView, with unique stacking, dynamic dashboard, and advanced filter/expiry management.

MTF K-Means Price Regimes [matteovesperi] ⚠️ The preview uses a custom example to identify support/resistance zones. due to the fact that this identifier clusterizes, this is possible. this example was set up "in a hurry", therefore it has a possible inaccuracy. When setting up the indicator, it is extremely important to select the correct parameters and double-check them on the selected history.
📊 OVERVIEW
Purpose
MTF K-Means Price Regimes is a TradingView indicator that automatically identifies and classifies the current market regime based on the K-Means machine learning algorithm. The indicator uses data from a higher timeframe (Multi-TimeFrame, MTF) to build stable classification and applies it to the working timeframe in real-time.
Key Features
✅ Automatic market regime detection — the algorithm finds clusters of similar market conditions
✅ Multi-timeframe (MTF) — clustering on higher TF, application on lower TF
✅ Adaptive — model recalculates when a new HTF bar appears with a rolling window
✅ Non-Repainting — classification is performed only on closed bars
✅ Visualization — bar coloring + information panel with cluster characteristics
✅ Flexible settings — from 2 to 10 clusters, customizable feature periods, HTF selection
━━━━━━━━━━━━━━━━━━━━━━━━━━━━━━━━━━━━━━━━━━━━━━━━━━━━━━━━━━━━━━━━━
🔬 TECHNICAL DETAILS
K-Means Clustering Algorithm
What is K-Means?
K-Means is one of the most popular clustering algorithms (unsupervised machine learning). It divides a dataset into K groups (clusters) so that similar elements are within each cluster, and different elements are between clusters.
Algorithm objective:
Minimize within-cluster variance (sum of squared distances from points to their cluster center).
How Does K-Means Work in Our Indicator?
Step 1: Data Collection
The indicator accumulates history from the higher timeframe (HTF):
RSI (Relative Strength Index) — overbought/oversold indicator
ATR% (Average True Range as % of price) — volatility indicator
ΔP% (Price Change in %) — trend strength and direction indicator
By default, 200 HTF bars are accumulated (clusterLookback parameter).
Step 2: Creating Feature Vectors
Each HTF bar is described by a three-dimensional vector:
Vector =
Step 3: Normalization (Z-Score)
All features are normalized to bring them to a common scale:
Normalized_Value = (Value - Mean) / StdDev
This is critically important, as RSI is in the range 0-100, while ATR% and ΔP% have different scales. Without normalization, one feature would dominate over others.
Step 4: K-Means++ Centroid Initialization
Instead of random selection of K initial centers, an improved K-Means++ method is used:
First centroid is randomly selected from the data
Each subsequent centroid is selected with probability proportional to the square of the distance to the nearest already selected centroid
This ensures better initial centroid distribution and faster convergence
Step 5: Iterative Optimization (Lloyd's Algorithm)
Repeat until convergence (or maxIterations):
1. Assignment step:
For each point find the nearest centroid and assign it to this cluster
2. Update step:
Recalculate centroids as the average of all points in each cluster
3. Convergence check:
If centroids shifted less than 0.001 → STOP
Euclidean distance in 3D space is used:
Distance = sqrt((RSI1 - RSI2)² + (ATR1 - ATR2)² + (ΔP1 - ΔP2)²)
Step 6: Adaptive Update
With each new HTF bar:
The oldest bar is removed from history (rolling window method)
New bar is added to history
K-Means algorithm is executed again on updated data
Model remains relevant for current market conditions
Real-Time Classification
After building the model (clusters + centroids), the indicator works in classification mode:
On each closed bar of the current timeframe, RSI, ATR%, ΔP% are calculated
Feature vector is normalized using HTF statistics (Mean/StdDev)
Distance to all K centroids is calculated
Bar is assigned to the cluster with minimum distance
Bar is colored with the corresponding cluster color
Important: Classification occurs only on a closed bar (barstate.isconfirmed), which guarantees no repainting .
Data Architecture
Persistent variables (var):
├── featureVectors - Normalized HTF feature vectors
├── centroids - Cluster center coordinates (K * 3 values)
├── assignments - Assignment of each HTF bar to a cluster
├── htfRsiHistory - History of RSI values from HTF
├── htfAtrHistory - History of ATR values from HTF
├── htfPcHistory - History of price changes from HTF
├── htfCloseHistory - History of close prices from HTF
├── htfRsiMean, htfRsiStd - Statistics for RSI normalization
├── htfAtrMean, htfAtrStd - Statistics for ATR normalization
├── htfPcMean, htfPcStd - Statistics for Price Change normalization
├── isCalculated - Model readiness flag
└── currentCluster - Current active cluster
All arrays are synchronized and updated atomically when a new HTF bar appears.
Computational Complexity
Data collection: O(1) per bar
K-Means (one pass):
- Assignment: O(N * K) where N = number of points, K = number of clusters
- Update: O(N * K)
- Total: O(N * K * I) where I = number of iterations (usually 5-20)
Example: With N=200 HTF bars, K=5 clusters, I=20 iterations:
200 * 5 * 20 = 20,000 operations (executes quickly)
━━━━━━━━━━━━━━━━━━━━━━━━━━━━━━━━━━━━━━━━━━━━━━━━━━━━━━━━━━━━━━━━━
📖 USER GUIDE
Quick Start
1. Adding the Indicator
TradingView → Indicators → Favorites → MTF K-Means Price Regimes
Or copy the code from mtf_kmeans_price_regimes.pine into Pine Editor.
2. First Launch
When adding the indicator to the chart, you'll see a table in the upper right corner:
┌─────────────────────────┐
│ Status │ Collecting HTF │
├─────────────────────────┤
│ Collected│ 15 / 50 │
└─────────────────────────┘
This means the indicator is accumulating history from the higher timeframe. Wait until the counter reaches the minimum (default 50 bars for K=5).
3. Active Operation
After data collection is complete, the main table with cluster information will appear:
┌────┬──────┬──────┬──────┬──────────────┬────────┐
│ ID │ RSI │ ATR% │ ΔP% │ Description │Current │
├────┼──────┼──────┼──────┼──────────────┼────────┤
│ 1 │ 68.5 │ 2.15 │ 1.2 │ High Vol,Bull│ │
│ 2 │ 52.3 │ 0.85 │ 0.1 │ Low Vol,Flat │ ► │
│ 3 │ 35.2 │ 1.95 │ -1.5 │ High Vol,Bear│ │
└────┴──────┴──────┴──────┴──────────────┴────────┘
The arrow ► indicates the current active regime. Chart bars are colored with the corresponding cluster color.
Customizing for Your Strategy
Choosing Higher Timeframe (HTF)
Rule: HTF should be at least 4 times higher than the working timeframe.
| Working TF | Recommended HTF |
|------------|-----------------|
| 1 min | 15 min - 1H |
| 5 min | 1H - 4H |
| 15 min | 4H - D |
| 1H | D - W |
| 4H | D - W |
| D | W - M |
HTF Selection Effect:
Lower HTF (closer to working TF): More sensitive, frequently changing classification
Higher HTF (much larger than working TF): More stable, long-term regime assessment
Number of Clusters (K)
K = 2-3: Rough division (e.g., "uptrend", "downtrend", "flat")
K = 4-5: Optimal for most cases (DEFAULT: 5)
K = 6-8: Detailed segmentation (requires more data)
K = 9-10: Very fine division (only for long-term analysis with large windows)
Important constraint:
clusterLookback ≥ numClusters * 10
I.e., for K=5 you need at least 50 HTF bars, for K=10 — at least 100 bars.
Clustering Depth (clusterLookback)
This is the rolling window size for building the model.
50-100 HTF bars: Fast adaptation to market changes
200 HTF bars: Optimal balance (DEFAULT)
500-1000 HTF bars: Long-term, stable model
If you get an "Insufficient data" error:
Decrease clusterLookback
Or select a lower HTF (e.g., "4H" instead of "D")
Or decrease numClusters
Color Scheme
Default 10 colors:
Red → Often: strong bearish, high volatility
Orange → Transition, medium volatility
Yellow → Neutral, decreasing activity
Green → Often: strong bullish, high volatility
Blue → Medium bullish, medium volatility
Purple → Oversold, possible reversal
Fuchsia → Overbought, possible reversal
Lime → Strong upward momentum
Aqua → Consolidation, low volatility
White → Undefined regime (rare)
Important: Cluster colors are assigned randomly at each model recalculation! Don't rely on "red = bearish". Instead, look at the description in the table (RSI, ATR%, ΔP%).
You can customize colors in the "Colors" settings section.
━━━━━━━━━━━━━━━━━━━━━━━━━━━━━━━━━━━━━━━━━━━━━━━━━━━━━━━━━━━━━━━━━
⚙️ INDICATOR PARAMETERS
Main Parameters
Higher Timeframe (htf)
Type: Timeframe selection
Default: "D" (daily)
Description: Timeframe on which the clustering model is built
Recommendation: At least 4 times larger than your working TF
Clustering Depth (clusterLookback)
Type: Integer
Range: 50 - 2000
Default: 200
Description: Number of HTF bars for building the model (rolling window size)
Recommendation:
- Increase for more stable long-term model
- Decrease for fast adaptation or if there's insufficient historical data
Number of Clusters (K) (numClusters)
Type: Integer
Range: 2 - 10
Default: 5
Description: Number of market regimes the algorithm will identify
Recommendation:
- K=3-4 for simple strategies (trending/ranging)
- K=5-6 for universal strategies
- K=7-10 only when clusterLookback ≥ 100*K
Max K-Means Iterations (maxIterations)
Type: Integer
Range: 5 - 50
Default: 20
Description: Maximum number of algorithm iterations
Recommendation:
- 10-20 is sufficient for most cases
- Increase to 30-50 if using K > 7
Feature Parameters
RSI Period (rsiLength)
Type: Integer
Default: 14
Description: Period for RSI calculation (overbought/oversold feature)
Recommendation:
- 14 — standard
- 7-10 — more sensitive
- 20-25 — more smoothed
ATR Period (atrLength)
Type: Integer
Default: 14
Description: Period for ATR calculation (volatility feature)
Recommendation: Usually kept equal to rsiLength
Price Change Period (pcLength)
Type: Integer
Default: 5
Description: Period for percentage price change calculation (trend feature)
Recommendation:
- 3-5 — short-term trend
- 10-20 — medium-term trend
Visualization
Show Info Panel (showDashboard)
Type: Checkbox
Default: true
Description: Enables/disables the information table on the chart
Cluster Color 1-10
Type: Color selection
Description: Customize colors for visual cluster distinction
Recommendation: Use contrasting colors for better readability
━━━━━━━━━━━━━━━━━━━━━━━━━━━━━━━━━━━━━━━━━━━━━━━━━━━━━━━━━━━━━━━━━
📊 INTERPRETING RESULTS
Reading the Information Table
┌────┬──────┬──────┬──────┬──────────────┬────────┐
│ ID │ RSI │ ATR% │ ΔP% │ Description │Current │
├────┼──────┼──────┼──────┼──────────────┼────────┤
│ 1 │ 68.5 │ 2.15 │ 1.2 │ High Vol,Bull│ │
│ 2 │ 52.3 │ 0.85 │ 0.1 │ Low Vol,Flat │ ► │
│ 3 │ 35.2 │ 1.95 │ -1.5 │ High Vol,Bear│ │
│ 4 │ 45.0 │ 1.20 │ -0.3 │ Low Vol,Bear │ │
│ 5 │ 72.1 │ 3.05 │ 2.8 │ High Vol,Bull│ │
└────┴──────┴──────┴──────┴──────────────┴────────┘
"ID" Column
Cluster number (1-K). Order doesn't matter.
"RSI" Column
Average RSI value in the cluster (0-100):
< 30: Oversold zone
30-45: Bearish sentiment
45-55: Neutral zone
55-70: Bullish sentiment
> 70: Overbought zone
"ATR%" Column
Average volatility in the cluster (as % of price):
< 1%: Low volatility (consolidation, narrow range)
1-2%: Normal volatility
2-3%: Elevated volatility
> 3%: High volatility (strong movements, impulses)
Compared to the average volatility across all clusters to determine "High Vol" or "Low Vol".
"ΔP%" Column
Average price change in the cluster (in % over pcLength period):
> +0.05%: Bullish regime
-0.05% ... +0.05%: Flat (sideways movement)
< -0.05%: Bearish regime
"Description" Column
Automatic interpretation:
"High Vol, Bull" → Strong upward momentum, high activity
"Low Vol, Flat" → Consolidation, narrow range, uncertainty
"High Vol, Bear" → Strong decline, panic, high activity
"Low Vol, Bull" → Slow growth, low activity
"Low Vol, Bear" → Slow decline, low activity
"Current" Column
Arrow ► shows which cluster the last closed bar of your working timeframe is in.
Typical Cluster Patterns
Example 1: Trend/Flat Division (K=3)
Cluster 1: RSI=65, ATR%=2.5, ΔP%=+1.5 → Bullish trend
Cluster 2: RSI=50, ATR%=0.8, ΔP%=0.0 → Flat/Consolidation
Cluster 3: RSI=35, ATR%=2.3, ΔP%=-1.4 → Bearish trend
Strategy: Open positions when regime changes Flat → Trend, avoid flat.
Example 2: Volatility Breakdown (K=5)
Cluster 1: RSI=72, ATR%=3.5, ΔP%=+2.5 → Strong bullish impulse (high risk)
Cluster 2: RSI=60, ATR%=1.5, ΔP%=+0.8 → Moderate bullish (optimal entry point)
Cluster 3: RSI=50, ATR%=0.7, ΔP%=0.0 → Flat
Cluster 4: RSI=40, ATR%=1.4, ΔP%=-0.7 → Moderate bearish
Cluster 5: RSI=28, ATR%=3.2, ΔP%=-2.3 → Strong bearish impulse (panic)
Strategy: Enter in Cluster 2 or 4, avoid extremes (1, 5).
Example 3: Mixed Regimes (K=7+)
With large K, clusters can represent condition combinations:
High RSI + Low volatility → "Quiet overbought"
Neutral RSI + High volatility → "Uncertainty with high activity"
Etc.
Requires individual analysis of each cluster.
Regime Changes
Important signal: Transition from one cluster to another!
Trading situation examples:
Flat → Bullish trend → Buy signal
Bullish trend → Flat → Take profit, close longs
Flat → Bearish trend → Sell signal
Bearish trend → Flat → Close shorts, wait
You can build a trading system based on the current active cluster and transitions between them.
━━━━━━━━━━━━━━━━━━━━━━━━━━━━━━━━━━━━━━━━━━━━━━━━━━━━━━━━━━━━━━━━━
💡 USAGE EXAMPLES
Example 1: Scalping with HTF Filter
Task: Scalping on 5-minute charts, but only enter in the direction of the daily regime.
Settings:
Working TF: 5 min
HTF: D (daily)
K: 3 (simple division)
clusterLookback: 100
Logic:
IF current cluster = "Bullish" (ΔP% > 0.5)
→ Look for long entry points on 5M
IF current cluster = "Bearish" (ΔP% < -0.5)
→ Look for short entry points on 5M
IF current cluster = "Flat"
→ Don't trade / reduce risk
Example 2: Swing Trading with Volatility Filtering
Task: Swing trading on 4H, enter only in regimes with medium volatility.
Settings:
Working TF: 4H
HTF: D (daily)
K: 5
clusterLookback: 200
Logic:
Allowed clusters for entry:
- ATR% from 1.5% to 2.5% (not too quiet, not too chaotic)
- ΔP% with clear direction (|ΔP%| > 0.5)
Prohibited clusters:
- ATR% > 3% → Too risky (possible gaps, sharp reversals)
- ATR% < 1% → Too quiet (small movements, commissions eat profit)
Example 3: Portfolio Rotation
Task: Managing a portfolio of multiple assets, allocate capital depending on regimes.
Settings:
Working TF: D (daily)
HTF: W (weekly)
K: 4
clusterLookback: 100
Logic:
For each asset in portfolio:
IF regime = "Strong trend + Low volatility"
→ Increase asset weight in portfolio (40-50%)
IF regime = "Medium trend + Medium volatility"
→ Standard weight (20-30%)
IF regime = "Flat" or "High volatility without trend"
→ Minimum weight or exclude (0-10%)
Example 4: Combining with Other Indicators
MTF K-Means as a filter:
Main strategy: MA Crossover
Filter: MTF K-Means on higher TF
Rule:
IF MA_fast > MA_slow AND Cluster = "Bullish regime"
→ LONG
IF MA_fast < MA_slow AND Cluster = "Bearish regime"
→ SHORT
ELSE
→ Don't trade (regime doesn't confirm signal)
This dramatically reduces false signals in unsuitable market conditions.
━━━━━━━━━━━━━━━━━━━━━━━━━━━━━━━━━━━━━━━━━━━━━━━━━━━━━━━━━━━━━━━━━
📈 OPTIMIZATION RECOMMENDATIONS
Optimal Settings for Different Styles
Day Trading
Working TF: 5M - 15M
HTF: 1H - 4H
numClusters: 4-5
clusterLookback: 100-150
Swing Trading
Working TF: 1H - 4H
HTF: D
numClusters: 5-6
clusterLookback: 150-250
Position Trading
Working TF: D
HTF: W - M
numClusters: 4-5
clusterLookback: 100-200
Scalping
Working TF: 1M - 5M
HTF: 15M - 1H
numClusters: 3-4
clusterLookback: 50-100
Backtesting
To evaluate effectiveness:
Load historical data (minimum 2x clusterLookback HTF bars)
Apply the indicator with your settings
Study cluster change history:
- Do changes coincide with actual trend transitions?
- How often do false signals occur?
Optimize parameters:
- If too much noise → increase HTF or clusterLookback
- If reaction too slow → decrease HTF or increase numClusters
Combining with Other Techniques
Regime-Based Approach:
MTF K-Means (regime identification)
↓
+---+---+---+
| | | |
v v v v
Trend Flat High_Vol Low_Vol
↓ ↓ ↓ ↓
Strategy_A Strategy_B Don't_trade
Examples:
Trend: Use trend-following strategies (MA crossover, Breakout)
Flat: Use mean-reversion strategies (RSI, Bollinger Bands)
High volatility: Reduce position sizes, widen stops
Low volatility: Expect breakout, don't open positions inside range
━━━━━━━━━━━━━━━━━━━━━━━━━━━━━━━━━━━━━━━━━━━━━━━━━━━━━━━━━━━━━━━━━
📞 SUPPORT
Report an Issue
If you found a bug or have a suggestion for improvement:
Describe the problem in as much detail as possible
Specify your indicator settings
Attach a screenshot (if possible)
Specify the asset and timeframe where the problem is observed

Smart BUY/SELL Pop IndicatorSmart BUY/SELL Indicator
This indicator shows BUY and SELL labels directly on your TradingView chart. Green labels indicate potential upward moves, and red labels indicate potential downward moves.
How it works
It uses two moving averages: a fast (9-period) and a slow (21-period). A BUY signal appears when the fast MA crosses above the slow MA, and a SELL signal appears when it crosses below.
Why it’s useful
It gives a visual guide for entry and exit points without alert messages. Accuracy can improve by adding filters like RSI or MACD.

GRG/RGR Signal, MA, Ranges and PivotsThis indicator is a combination of several indicators.
It is a combination of two of my indicators which I solely use for trading
1. EMA 10-20-50-200, Pivots and Previous Day/Week/Month range
2. 3/4-Bar GRG / RGR Pattern (Conditional 4th Candle)
You can use them individually if you already have some of them or just use this one. Belive me when I say, this is all you need, along with market structure knowlege and even if you don’t have that, this indicator has been doing wonders for me. This is all I use. I do not use anything else.
**Note - Do checkout the indicators individually as I have added valuable information in the comment section.
It contains the following,
1. 10 EMA/SMA - configurable
2. 20 EMA/SMA - configurable
3. 50 EMA/SMA - configurable
4. 200 EMA/SMA - configurable
5. Previous Day's Range - configurable
6. Previous Week's Range - configurable
7. Previous Month's Range - configurable
8. Pivots - configurable
9. Buy Sell Signal - configurable
The Moving Averages
It is a very important combination and using it correctly with price action will strengthen your entries and exits.
The ema's or sma's added are the most powerful ones and they do definitely act as support and resistance.
The Daily/Weekly/Monthly Ranges
The Daily/Weekly/Monthly ranges are extremely important for any trader and should be used for targets and reversals.
Pivots
Pivots can provide support and resistance level. R5 and S5 can be used to check for over stretched conditions. You can customise them however you like. It is a full pivot indicator.
It is defaulted to show R5 and S5 only to reduce noise in the chart but it can be customised.
The 3/4 RGR or GRG Signal Generator
Combined with a 3/4 RGR or GRG setup can be all a trader needs.
You don't need complex strategies and SMC concepts to trade. Simple EMAs, ranges and RGR/GRG setup is the most winning combination.
This indicator can be used to identify the Green-Red-Green or Red-Green-Red pattern.
It is a price action indicator where a price action which identifies the defeat of buyers and sellers.
If the buyers comprehensively defeat the sellers then the price moves up and if the sellers defeat the buyers then the price moves down.
In my trading experience this is what defines the price movement.
It is a 3 or 4 candle pattern, beyond that i.e, 5 or more candles could mean a very sideways market and unnecessary signal generation.
How does it work?
Upside/Green signal
1. Say candle 1 is Green, which means buyers stepped in, then candle 2 is Red or a Doji, that means sellers brought the price down. Then if candle 3 is forming to be Green and breaks the closing of the 1st candle and opening of the 2nd candle, then a green arrow will appear and that is the place where you want to take your trade.
2. Here the buyers defeated the sellers.
3. Sometimes candle 3 falls short but candle 4 breaks candle 1's closing and candle 2's opening price. We can enter on candle 4.
4. Important - We need to enter the trade as soon as the price moves above the candle 1 and 2's body and should not wait for the 3rd or 4th candle to close. Ignore wicks.
5. But for a more optimised entry I have added an option to use candle’s highs and lows instead of open and close. This reduces lot of noise and provides us with more precise entry. This setting is turned on by default.
6. I have restricted it to 4 candles and that is all that is needed. More than that is a longer sideways market.
7. I call it the +-+ or GRG pattern or Green-Red-Green or Buyer-Seller-Buyer or Seller defeated or just Buyer pattern.
8. Stop loss can be candle 2's mid for safe traders (that includes me) or candle 2's body low for risky traders.
9. Back testing suggests that body low will be useless and result in more points in loss because for the bigger move this point will not be touched, so why not get out faster.
Downside/Red signal
1. Say candle 1 is Red, which means sellers stepped in, then candle 2 is Green or a Doji, that means buyers took the price up. Then if candle 3 is forming to be Red and breaks the closing of the 1st candle and opening of the 2nd candle then a Red arrow will appear and that is the place where you want to take your trade.
2. Sometimes candle 3 falls short but candle 4 breaks candle 1's closing and candle 2's opening price. We can enter on candle 4.
3. We need to enter the trade as soon as the price moves below the candle 1 and 2's body and should not wait for the 3rd or 4th candle to close.
4. But for a more optimised entry I have added an option to use candle’s highs and lows instead of open and close. This reduces lot of noise and provides us with more precise entry. This setting is turned on by default.
5. I have restricted it to 4 candles and that is all that is needed. More than that is a longer sideways market.
6. I call it the -+- or RGR pattern or Red-Green-Red or Seller-Buyer-Seller or Buyer defeated or just Seller pattern.
7. Stop loss can be candle 2's mid for safe traders ( that includes me) or candle 2's body high for risky traders.
8. Back testing suggests that body high will be useless and result in more points in loss because for the bigger move this point will not be touched, so why not get out faster.
Combining Indicators and Signal
Combining these indicators with GRG/RGR signal can be very powerful and can provide big moves.
1. MA crossover and Signal - This is very powerful and provides a very big move. Trades can be held for longer. If after taking the trade we notice that the MA crossover has happened then trades can be held for higher targets.
2. Pivots and Signal - Pivots and add a support or resistance point. Take profits on these points. R5/S5 are over streched conditions so we can start looking for reversal signals and ignore other signals
3. Intraday Range - first 1, 5, 15 min of the day - Sideways days is when price will stay in these ranges. You can take profits at these ranges or if the range is broken and we get a signal, then it can mean that the direction will be sustained.
4. Previous Day/Week/Month Ranges - These can be used as Take Profit points if the price is moving towards them after getting the signal. If the range is broken and we get a signal then it can be a strong signal. They can also be used as reversal points if a strong signal is generated.
Important Settings
1. Include 4th Candle Confirmation - You can enable or disable the 4th candle signal to avoid the noise, but at times I have noticed that the 4th candle gives a very strong signal or I can say that the strong signal falls on the 4th candle. This is mostly a coincidence.
2. Bars to check (default 10) - You can also configure how many previous bars should the signal be generated for. 10 to 30 is good enough. To backtest increase it to 2000 or 5000 for example.
3. Use Candle High/Low for confirmation instead of Candle Open/Close - More optimized entry and noise reduction. This option is now defaulted to false.
4. Show Green-Red-Green (bull) signals - Show only bull entries. Useful when I have a predefined view i.e, I know market is going to go up today.
5. Show Red-Green-Red (bear) signals - Show only bear entries. Useful when I have a predefined view i.e, I know market is going to go down today.
6. 3rd candle should be a Strong candle before considering 4th candle - This will enforce additional logic in 4 candle setup that the 3rd candle is the candle in our direction of breakout. This means something like GRGG is mandatory, which is still the default behaviour. If disabled, the 3rd candle can be any candle and 4th candle will act as our breakout candle. This behaviour has led to breakouts and breakdowns as times, hence I added this as a separate feature. Vice-versa for a RGGR.
For a 4 candle setup till now we were expecting GRGG or RGRR but we can let the system ignore the 3rd candle completely if needed.
This will result in additional signals.
7. Three intraday ranges added for index and stock traders - 1 min, 5 min and 15 min ranges will be displayed. These are disabled by default except 15 min. These are very important ranges and in sideways days the price will usually move within the 15 min. A breakout of this range and a positive signal can be a very powerful setup.
Safe traders can avoid taking a trade in this range as it can lead to fakeouts.
The line style, width, color and opacity are configurable.
Pointers/Golden Rules
1. If after taking the trade, the next candle moves in your direction and closes strong bullish or bearish, then move SL to break even and after that you can trail it.
2. If a upside trade hits SL and immediately a down side trade signal is generated on the next candle then take it. Vice versa is true.
3. Trades need to be taken on previous 2 candle's body high or low combined and not the wicks.
4. The most losses a trader takes is on a sideways day and because in our strategy the stop loss is so small that even on a sideways day we'll get out with a little profit or worst break even.
5. Hold trades for longer targets and don't panic.
6. If last 3-4 days have been sideways then there is a good probability that today will be trending so we can hold our trade for longer targets. Inverse is true when the market has been trending for 2-3 days then volatility followed by sideways is coming (DOW theory). Target to hold the trade for whole day and not exit till the day closes.
7. In general avoid trading in the middle of the day for index and stocks. Divide the day into 3 parts and avoid the middle.
8. Use Support/Resistance, 10, 20, 50, 200 EMA/SMA, Gaps, Whole/Round numbers(very imp) for identifying targets.
9. Trail your SL.
10. For indexes I would use 5 min and 15 min timeframe and at times 10 mins.
11. For commodities and crypto we can use higher timeframe as well. Look for signals during volatile time durations and avoid trading the whole day. Signal usually gives good targets on those times.
12. If a GRG or RGR pattern appears on a daily timeframe then this is our time to go big.
13. Minimum Risk to Reward should be 1:2 and for longer targets can be 1:4 to 1:10.
14. Trade with small lot size. Money management will happen automatically.
15. With small lot size and correct Risk-Reward we can be very profitable. Don't trade with big lot size.
16. Stay in the market for longer and collect points not money.
17. Very imp - Watch market and learn to generate a market view.
18. Very imp - Only 3 type of candles are needed in trading -
Strong Bullish (Big Green candle), Strong Bearish (Big Red candle),
Hammer (it is Strong Bullish), Inverse Hammer (it is Strong Bearish)
and Doji (indecision or confusion).
If on daily timeframe I see Strong Bullish candle previous day then I am biased to the upside the next day, if I see Strong Bearish candle the previous day then I am biased to the downside the next day, if I see Doji on the previous day then I am cautious the next day, if there are back to back Dojis forming in daily or weekly then I am preparing for big move so time to go big once I get the signal.
19. Most Important Candlestick pattern - Bullish and Bearish Engulfing
20. The only Chart patterns I need -
a) Falling Wedge/Channel Bullish Pattern Uptrend or Bull Flag - Buying - Forming over a couple days for intraday and forming over a couple of weeks for swing
b) Falling Wedge/Channel Bullish Pattern Downtrend or Falling Channel - Buying
c) Rising Wedge Bearish Pattern Uptrend or Rising Channel - Selling
d) Rising Wedge Bearish Pattern Downtrend or Bear flag - Selling
e) Head and Shoulder - Over a longer period not for intraday. In 15 min takes few days and for swing 1hr or 4h or daily can take few days
f) M and W pattern - Reversal Patterns - They form within the above 4 patterns, usually resulting in the break of trend line
21. How Gaps work -
a) Small Gap up in Uptrend - Market can fill the gap and reverse. The perception is that people are buying. If previous day candle was Strong Bullish then market view is up.
b) Big Gap up in Uptrend - Not news driven - Profit booking will come but may not fill the entire gap
c) Big Gap up in Uptrend - News driven, war related, tax, interest rate - Market can keep going up without stopping.
c) Flat opening in Uptrend - Big chance of market going up. If previous day candle was Strong Bullish then view is upwards, if it was Doji then still upwards.
d) Gap down in Uptrend - Market is surprised. After going down initially it can go up
e) Small Gap down in Downtrend - Market can fill the gap and keep moving down. If previous day candle was Strong Bearish then view is still down.
f) Flat opening in Downtrend - View is down, short today.
g) Big Gap down in Downtrend - Profit booking and foolish buying will come but market view is still down.
h) Gap down with News - Volatility, sideways then down.
i) Gap Up in Downtrend - Can move up - Price can move up during 2/3rd of the day and End of the day revert and close in red.
22. Go big on bearish days for option traders. Puts are better bought and Calls are better sold.
23. Cluster of green signals can lead to bigger move on the upside and vice versa for red signals.
24. Most of this is what I learned from successful traders (from the top 2%) only the indicator is mine.

Specter Trend Cloud [ChartPrime]⯁ OVERVIEW
Specter Trend Cloud is a flexible moving-average–based trend tool that builds a colored “cloud” around market direction and highlights key retest opportunities. Using two adaptive MAs (short vs. long), offset by ATR for volatility adjustment, it shades the background with a gradient cloud that switches color on trend flips. When price pulls back to retest the short MA during an active trend, the script plots diamond markers and extends dotted levels from that retest price. If price later breaks through that level, the extension is terminated—giving traders a clean visual of valid vs. invalid retests.
⯁ KEY FEATURES
Multi-MA Core Engine:
Choose from SMA, EMA, SMMA (RMA), WMA, or VWMA as the base. The indicator tracks both a short-term MA (Length) and a longer twin (2 × Length).
Volatility-Adjusted Offset:
Both MAs are shifted by ATR(200) depending on trend direction—pulling them down in uptrends, up in downtrends—so the cloud reflects realistic breathing room instead of razor-thin bands.
Gradient Trend Cloud:
Between the two shifted MAs, the script fills a shaded region:
• Aqua cloud = bullish trend
• Orange cloud = bearish trend
Gradient intensity increases toward the active edge, providing a visual sense of strength.
Trend Flip Logic:
A flip occurs whenever the short MA crosses above or below the long MA. The cloud instantly changes color and begins tracking the new regime.
Retest Detection:
During an ongoing trend (no flip), if price retests the short MA within a 5-bar “cooldown,” the tool:
• Marks the retest with diamond shapes below/above the bar.
• Draws a dotted horizontal line from the retest price, extending into the future.
Automatic Level Termination:
If price later closes through that dotted level, the line disappears—keeping only active, respected retest levels on your chart.
⯁ HOW IT WORKS (UNDER THE HOOD)
MA Calculations:
ma1 = MA(src, Length), ma2 = MA(src, 2 × Length).
Trend = ma1 > ma2 (bull) or ma1 < ma2 (bear).
ATR shift offsets both ma1 and ma2 by ±ATR depending on trend.
Cloud Fill:
Plots ma1 and ma2 (invisible for long MA). Uses fill() with semi-transparent aqua/orange gradient between the two.
Retest Logic:
• Bullish retest: ta.crossover(low, ma1) while trend = bull.
• Bearish retest: ta.crossunder(high, ma1) while trend = bear.
Only valid if at least 5 bars have passed since last retest.
When triggered, it stores bar index and price, draws diamonds, and extends a dotted line.
Level Clearing:
If current high > retest upper line (bearish case) or low < retest lower line (bullish case), that line is deleted (stops extending).
⯁ USAGE
Use the cloud color as the higher-level trend bias (aqua = long, orange = short).
Look for diamonds + dotted lines as pullback/retest zones where trend continuation may launch.
If a retest level holds and price rebounds, it strengthens confidence in the trend.
If a retest level is broken, treat it as a warning of weakening trend or possible reversal.
Experiment with MA Type (SMA vs. EMA, etc.) to align sensitivity with your asset or timeframe.
Adjust Length for faster flips on low timeframes or smoother signals on higher ones.
⯁ CONCLUSION
Specter Trend Cloud combines trend detection, volatility-adjusted shading, and retest visualization into a single tool. The gradient cloud provides instant clarity on direction, while diamonds and dotted retest levels give you tactical entry/retest zones that self-clean when invalidated. It’s a versatile trend-following and confirmation layer, adaptable across multiple assets and styles.

Moving Average Heat MapThe MA Trend Heatmap transforms complex moving average analysis into an intuitive visual display. By calculating the slope angle of seven moving averages and presenting them as a color-coded heatmap, this indicator provides instant insight into market momentum across multiple timeframes.
Key Features:
8 Moving Average Types: Choose from EMA, SMA, WMA, HMA, RMA, VWMA, DEMA, or TEMA.
Customizable Periods: 7 configurable MA lengths (default: 3, 5, 8, 13, 21, 34, 55)
Dynamic Angle Calculation: Measures MA slope angles with automatic chart scale normalization
9-Level Color Gradient: Visual momentum strength from extreme bullish to extreme bearish
Comprehensive Info Table: Real-time display of all angles and momentum statistics
4 Alert Conditions: Extreme and majority momentum alerts for automated trading
How to Use:
Trend Identification: Green rows indicate bullish momentum, red rows show bearish momentum
Momentum Strength: Color intensity reflects angle steepness (brighter = stronger)
Confluence Trading: Look for alignment when multiple rows show the same color
Divergence Detection: Spot when short and long-term MAs show opposing colors
Alert Setup: Configure alerts for extreme momentum conditions
Settings:
Select MA type and customize each of the 7 period lengths
Calculation Settings
Slope Period: Lookback for angle calculation (default: 5)
Max Angle: Normalization threshold (default: 90°)
Display Settings
Heatmap Height: Adjust row size
Grid Lines: Toggle on/off
Info Table: Show/hide detailed statistics
Colors
Fully customizable 9-level color scheme
Interpretation
All Green: Strong uptrend across all timeframes
Mixed Colors: Transitional market or ranging conditions
All Red: Strong downtrend across all timeframes
Color Transitions: Potential trend change developing
Best Practices
Combine with price action for confirmation
Use multiple timeframes for better perspective
Wait for color alignment before entering trades
Monitor the info table for precise angle measurements
What Makes This Unique
Unlike traditional MA crossover systems, this indicator quantifies momentum through angle measurement and presents it visually. The heatmap format allows traders to assess market conditions at a glance, making it ideal for quick decision-making and multi-timeframe analysis.

Trend Detection with Alerts and ConsolidationHere’s a simple script in English that detects a trend based on two moving averages (MAs) and shows the trend direction on the chart. I’ll write it in Pine Script (TradingView), since it’s a common language for trading indicators:
How does it work?
Green background — uptrend
Red background — downtrend
Gray background — consolidation (MAs are close to each other)
Label with trend/consolidation description on the latest candle
Alerts triggered when the fast MA crosses the slow MA (trend change) — you can set these alerts as notifications in TradingView.

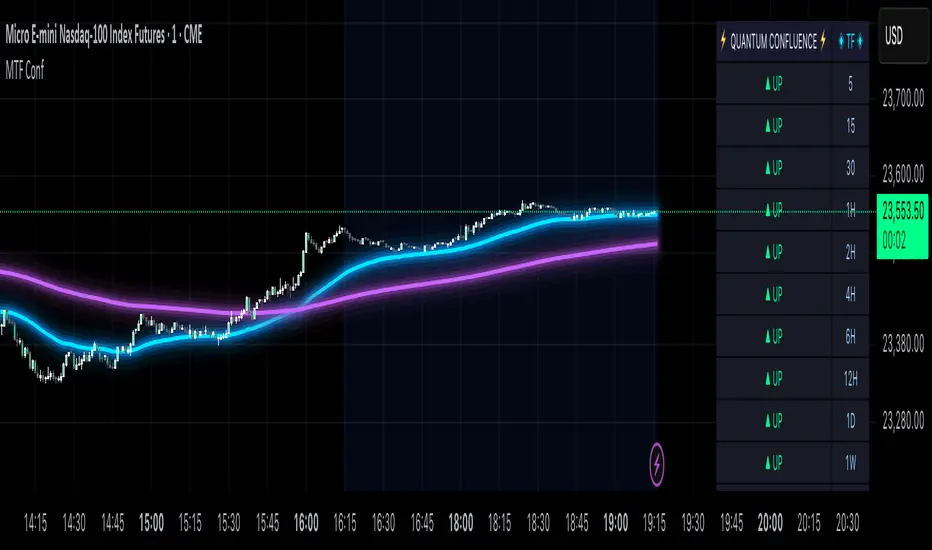
MTF Confluence Dashboard (Multi‑Timeframe Trend/Bias)MTF Confluence Dashboard — Multi‑Timeframe Trend/Bias Table + EMA
The MTF Confluence Dashboard is a fast, non‑repainting multi‑timeframe (MTF) confluence tool that shows higher‑timeframe trend and bias alignment in a compact, on‑chart table. It’s built for prop‑firm challenges and futures day traders who need instant top‑down confirmation without switching charts. Get a clean read of trend direction across your selected timeframes, plus on‑chart MAs for timing.
Why traders use it
* MTF Confluence at a glance: Trend/Bias table aggregates short vs long MA on 1m→1W (you pick which TFs show).
* Non‑repainting: Uses closed-bar higher‑TF data; reliable for alerts and evaluations.
* Futures + prop‑firm friendly: Minimal lag, lightweight, session‑agnostic; perfect for ES/NQ/CL/GC scalping or intraday swings.
Core features
* Trend/Bias Table: “Up / Down” per timeframe and an overall AVG sentiment.
* MA Engine: Choose MA type (SMA/EMA/WMA/HMA) and lengths (e.g., 50/200) to define bias.
* On‑Chart Confirmation: Plots short/long MAs for entry timing on your trading TF.
* Smart Alerts: Built‑in alerts for Strong Up/Up/Neutral/Down/Strong Down average bias.
* Custom Layout: Vertical or Horizontal table, resizable text (Tiny → Huge), corner positioning.
* Pro Visual Themes:
* Dark Intergalactic (neon/futuristic for dark charts)
* Light Minimal (clean light mode)
* Pro Modern (low‑saturation, desk‑ready)
How to trade it
* Scalps (1m–5m): Only take longs when 5m/15m/1H/D are “Up” and AVG is Up/Strong Up; use MA crosses/pulls for entries.
* Intraday swings (5m–15m–1H): Wait for a higher‑TF flip to align; trail under the long MA.
* Risk discipline: If AVG shifts to Neutral/Down, stop looking for longs until bias realigns.
Settings you’ll care about
* Timeframes to display (1m, 2m, 3m, 5m, 10m, 15m, 30m, 1H, 2H, 4H, 6H, 12H, 1D, 1W).
* MA Type: SMA / EMA / WMA / HMA.
* Short/Long lengths (defaults 50/200).
* Theme, orientation, and size.
Notes
* Works on all symbols and timeframes.
* No repainting; alerts trigger on closed conditions.
* Built by PineProfits.
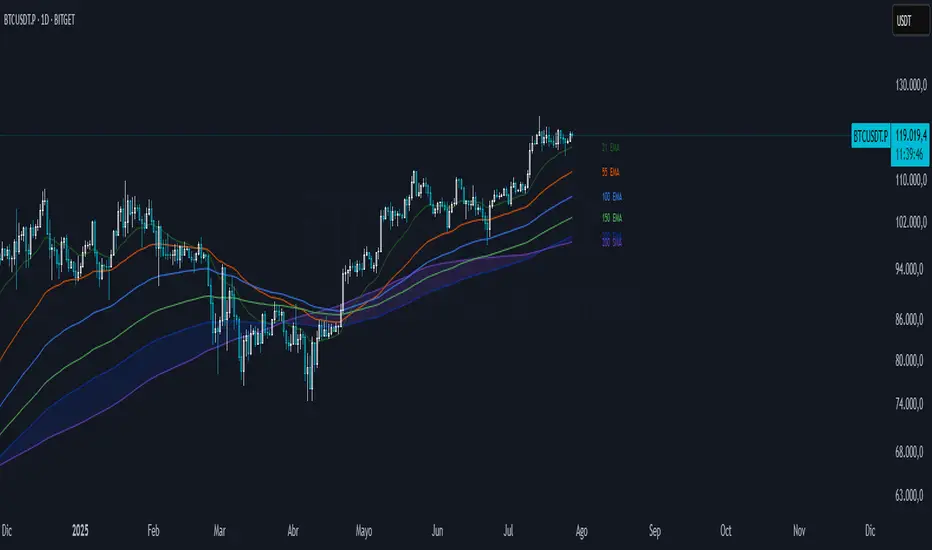
Dynamic Multi-Timeframe Moving Averages Matrix [CdeCripto]This indicator plots up to 10 customizable moving averages (EMA or SMA) from different timeframes on your chart, with optional colored fills and labels. Perfect for traders who want a clear, consolidated view of multiple trend signals at once.
Key Features
Up to 10 MAs: Independently toggle visibility, length, timeframe and type (EMA/SMA) for each moving average.
Multi-Timeframe Support: Fetches data via request.security, letting you overlay higher- or lower-frame MAs on any chart.
Conditional Fills: Optional translucent fills between adjacent MAs to highlight relative strength—green when the faster MA is above, red when below.
Dynamic Labels: On-chart text boxes showing MA length, period and type—fully configurable colour and size for quick reference.
Clean, Lightweight Code: Highly commented and optimized for performance; minimal risk of hitting TradingView’s line/label limits.
Inputs
MA Visibility: Show/hide each of the 10 moving averages.
Length & Type: Set period (e.g. 50, 200) and choose EMA or SMA.
Timeframe: Specify any built-in or custom timeframe (e.g. 1h, 4h, D, W, M).
Colour & Style: Pick distinct colours for each MA; adjust line width and style.
Fill Options: Toggle fills between MA1–MA2, MA2–MA3, … MA9–MA10 and set fill transparency.
Label Options: Turn labels on/off, override label colour, choose font size.
Usage
Scan multiple trend horizons at a glance—ideal for strategies that combine short, medium and long-term moving average signals.
Spot regime changes: when a shorter‐term MA crosses above/below a longer-term MA, the colored fill instantly highlights the shift.
Keep your chart tidy: show only the MAs and fills you need, hide the rest.
How to Add
Copy the Pine Script code into a new indicator in TradingView’s Pine Editor.
Click “Add to Chart.”
Open the settings panel to customize each MA, fills, and labels.
Disclaimer: For educational purposes only. Not financial advice.
MA Pullback Signal V1.1 [Tujac]This indicator will help you to find a MA Pullback Signal.
Features
Entry signals are generated under the following conditions:
Condition 1: When the 10, 20, and 50-period Moving Averages (MAs) are in either a bullish or bearish alignment , and their intervals narrow before expanding , a signal will appear.
Additionally , the Stochastic oscillator must be in an oversold/overbought zone , and the signal will only trigger if volume increases upon the 10-period MA breaking through the 20-period MA after a bounce.
Condition 2: When the 20, 50, and 100-period MAs are in either a bullish or bearish alignment , and their intervals narrow before expanding , a signal will appear.
Additionally , the Stochastic oscillator must be in an oversold/overbought zone , and the signal will only trigger if volume increases upon the 20-period MA breaking through the 50-period MA after a bounce.
Condition 3: If the 50-period MA and 200-period MA are in a bullish alignment , but the 10, 20, and 50-period MAs are in a bearish alignment , a signal will appear on a candle where a double bottom/double top forms, followed by an increase in volume .
Convergence Zone
Entry signals are hidden when the market is in a convergence zone .
Bollinger Bands, Keltner Channels, ADX, and Volume are used to determine if the market is in a convergence zone.
By default, entry signals will not appear in a convergence zone.
You can change the settings to allow signals to appear on candles that meet the entry conditions, even within a convergence zone.
Setting Options
Trend Type: Sets the type of Moving Average to determine pull-back entries.
MA F: Uses all four MAs (10/20/50/200) to determine pull-backs.
MA A/B/C: Uses only the 10/20/50 MAs to determine pull-backs.
MA F Trend: Sets which MA crossing the 200-period MA defines the base trend. The default is the 5-period MA.
MA Style: Sets the display style of the Moving Averages.
A: Displays the 200-period MA as a line and the 10/20-period MAs as a cloud.
B: Displays all 10/20/50/200-period MAs as lines.
C: Displays the 10/20-period MAs and the 90/100-period MAs as a cloud.
ADX Default: Sets the ADX value used to define the convergence zone.
Filter Squeeze: Enable this setting to hide entry signals during convergence zones.
Filter Over Sold/Bought: Enable this setting to hide entry signals when the market is in oversold/overbought zones.
Show Strong Signal: Displays signals with particularly high volume and price volatility.
Strength Level: Displays the strength of the signal.
Show All Signal: Displays both weak and strong signals.
Displays the 200-period MA as a line and the 10/20-period MAs as a cloud.
When the 10, 20, and 50-period Moving Averages (MAs) are in either a bullish or bearish alignment, and their intervals narrow before expanding, a signal will appear. Additionally, the Stochastic oscillator must be in an oversold/overbought zone, and the signal will only trigger if volume increases upon the 10-period MA breaking through the 20-period MA after a bounce.
Entry signals are hidden when the market is in a convergence zone.
The "Show All Signal" option allows you to display both weak and strong signals, providing a comprehensive view of all potential entry points identified by the system, regardless of their strength level.
If the 50-period MA and 200-period MA are in a bullish alignment, but the 10, 20, and 50-period MAs are in a bearish alignment, a signal will appear on a candle where a double bottom/double top forms, followed by an increase in volume.

BooRSI📘 BooRSI – Multi-Dimensional RSI Framework with Advanced Visual Context
BooRSI is not just another RSI overlay. It is a multi-layered momentum framework that blends traditional RSI dynamics with a set of enhanced visual and structural components to help traders identify market imbalances, momentum shifts, and confluence zones across multiple timeframes. The indicator was designed to assist both discretionary and systematic traders in spotting RSI-based inflection points with greater clarity and context.
🔍 What Makes BooRSI Different?
Unlike standard RSI tools, BooRSI provides a modular visualization layer that lets you:
View RSI in both candle format and classic line mode, making intrabar momentum shifts visible.
Plot dynamic or static Fibonacci retracement levels directly on the RSI scale — useful for identifying confluence between RSI pullbacks and trend continuation zones.
Activate a weekly RSI vs weekly RSI MA crossover highlight, enabling long-term trend filters directly within the intraday or daily RSI window.
Apply subtle gradient band fills to the 30–50–70 zones to enhance zone memory without overwhelming the visual space.
Toggle a custom RSI Moving Average for smoother signal interpretation.
🧠 Underlying Logic & Structure
RSI Calculation: Classic RSI with adjustable OHLC input (default: close). When in “Candle Mode,” it uses RSI(Open), RSI(High), RSI(Low), RSI(Close) to form OHLC candles for intrabar detail.
RSI MA Filter: A secondary SMA (default: 14) smooths RSI values to assist in trend determination.
Fibonacci Mapping: Based on a fixed or dynamic length (default: 55), key Fib levels (38.2%, 50%, 61.8%, etc.) are plotted on the RSI window to map out overreaction or pullback zones.
Multi-Timeframe Context: The system calculates weekly RSI and its moving average, then uses background highlights to show whether the current trend aligns with the higher timeframe momentum direction.
⚙️ Default Settings
Parameter Default Description
RSI Length 14 Base RSI period
RSI MA Length 14 SMA on RSI for trend filtering
Fibonacci Lookback 55 Length for Fibo level projections
Show 30/50/70 Bands True Gradient fill zones for RSI decision zones
Show Fibonacci Levels False Optional – static/dynamic Fib lines on RSI
Candle Mode False Switch between RSI line and RSI OHLC candles
Fibo Style Toggle True Switch between solid, dashed or dotted lines
🎯 Best Use Cases
Momentum Filters: For trend-based strategies, use RSI-MA and HTF background for filter alignment.
Reversal Signals: Use RSI candles to spot strong rejection patterns inside extreme zones.
Mean-Reversion Timing: Combine Fibonacci levels with 30–70 bands to fine-tune entries.
⚠️ Important Note
This is a closed-source indicator due to proprietary RSI candle mapping logic and unique Fibonacci interaction methods. However, this description fully discloses how the tool works and how it adds value beyond a basic RSI implementation.
BooRSI – Çok Katmanlı RSI Çerçevesi
BooRSI, klasik RSI göstergesini birden fazla katmanda zenginleştirerek momentum değişimlerini, aşırı alım/aşırı satım bölgelerini ve farklı zaman dilimi trendlerini daha net görmenizi sağlar:
Çubuk ve Çizgi Modu: RSI’yı hem OHLC mumları hem de klasik çizgi olarak gösterebilir, böylece intrabar hareketleri de izlenebilir.
RSI MA Filtreleme: RSI üzerine uygulanan SMA (varsayılan 14) trend yönünü belirlemenize yardımcı olur.
Fibonacci Seviyeleri: RSI ölçeği üzerinde dinamik veya sabit Fibonacci retracement çizgileri (38.2%, 50%, 61.8% vb.) ekleyerek dönüş ve devam bölgelerini tespit eder.
Haftalık Konteks: Günlük veya daha kısa zaman diliminde, haftalık RSI ve haftalık RSI MA kesişimlerini arka plan rengiyle vurgular.
Gradient 30/50/70 Bantları: Karar bölgelerini boğucu olmayan degradelerle öne çıkarır.
Bu kapalı kaynak gösterge, RSI mum haritalama ve Fib etkileşimindeki özgün mantığı nedeniyle gizlidir; açıklama ise nasıl çalıştığını tam olarak ortaya koyar.
